Or the benefits of Shared-Brain Syndrome.
BY ANDREW SORFLEET
After 25 years of intimate partnership, collaboration becomes second nature to the point that it is possible to lose track of who contributed what to a project.
A couple of months ago, I saw a story in a social media feed and began to read more. It was about David Bennett Hynd who was arrested by police in Vancouver. Hynd’s crime? Failing to comply with orders to take his HIV medications, conditions imposed by B.C. public health authorities to prevent the possibility of HIV transmission to others. His name and his photo, along with his HIV-positive status, were released to the media.
As my fascination with the story grew, I began to research the themes, policies and current events connected to the broader issue. At that point I knew I wanted to write a journalistic piece about it.
I figured that CATIE (Canadian AIDS Treatment Information Exchange, @CATIEinfo) would offer an appropriate audience for whom the story would be relevant. I had written before for CATIE regarding HIV treatment and sex workers. I had reached out to Canadian HIV/AIDS Legal Network (@AIDSLAW) early on, but the folks there were busy organizing a symposium on HIV, law and human rights. The staff at CATIE were eager to have me address this case for their blog.
As it turned out, the piece grew to 3300 words and was considered too journalistic and too long for CATIE’s blog. It became apparent to me that this would make an ideal first brief for our nonprofit, the Triple-X Workers’ Solidarity Association of B.C (@XXXWorkers). The editor at CATIE had suggested an approach and length that would suit the CATIE blog, so in the end we doubled the impact of this work!
Collaboration
Part of the way I collaborate with Will is through conversation — defined as turning-over-together. When I began to analyze the issues at play in the actions taken by provincial Public Health authorities and Vancouver police, key themes and serious concerns for Canadians’ rights and freedoms began to emerge. Will is a very visual person, and often sketches ideas in the style of editorial cartooning.
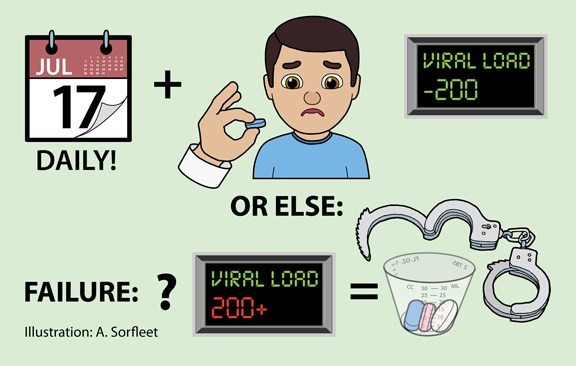
While I was obsessed with discovering and daylighting the step-by-step process David Hynd was subjected to, Will grabbed a marker and a sheet of paper and whipped up a sketch which had an element of satire as per usual. That sketch really helped me see the issue even more clearly. The sketch was “truthful” as it were. A picture’s hackneyed value of 1000 words was really true with that one.

I took the sketch and created a data visualization to include in the brief. Its a very powerful image i think. Its not truly an infographic, nor is it truly a political cartoon, nor is it wholly a technical illustration. But its elements of all three make it compelling and the emoji style was my touch, giving it familiarity and a more pictography element.
It was a fun collaboration.

Is your organization ready to publish a sharp, incisive and well-researched policy brief?
Could you or your organization use a creative data visualization that encapsulates an issue or process to illustrate your point?
If you have any questions, please get in touch at probono@policyandcompany.com or request a free quote.